Physical Address
304 North Cardinal St.
Dorchester Center, MA 02124
Physical Address
304 North Cardinal St.
Dorchester Center, MA 02124

Sunday closes with the kind of action that doesn’t seem like the end of a week at all, because instead of the usual drift of low energy, you get a market that continues to generate new points of tension.
From open oversized shorts with maximum leverage and almost zero breathing space to a clean technical setup on the XRP/BTC chart that can recreate the 40% growth pattern of July, to the heaviest long-term selling wave since the beginning of 2024, which now defines the macro picture much more than any intraday swing on Binance or Cobase.
The derivatives board opened the weekend with a block of positions that stands out immediately, not because the market has not seen large leveraged trades before, but because this was built with an absolute disregard for volatility. The combination of 40x BTC, 20x XRP and 10x ZEC in a $196 million block leaves no operational trail – the trader has essentially tied his fate to the next candle rather than any average time frame.
Even the unrealized profit sitting in the green does not provide consolation, because with this degree of leverage, the distance between profit and liquidation is measured in ticks.
You may also like it

Simultaneously, the previous trader who mirrored this aggressive stance is already under water and has lost a considerable part of his book via forced liquidation. The timing – less than a full day after the opening – shows how fragile leveraged shorts remain in the current environment, where Bitcoin it can drop or add several percentage points in minutes and XRP trades in quick bursts rather than controlled waves.
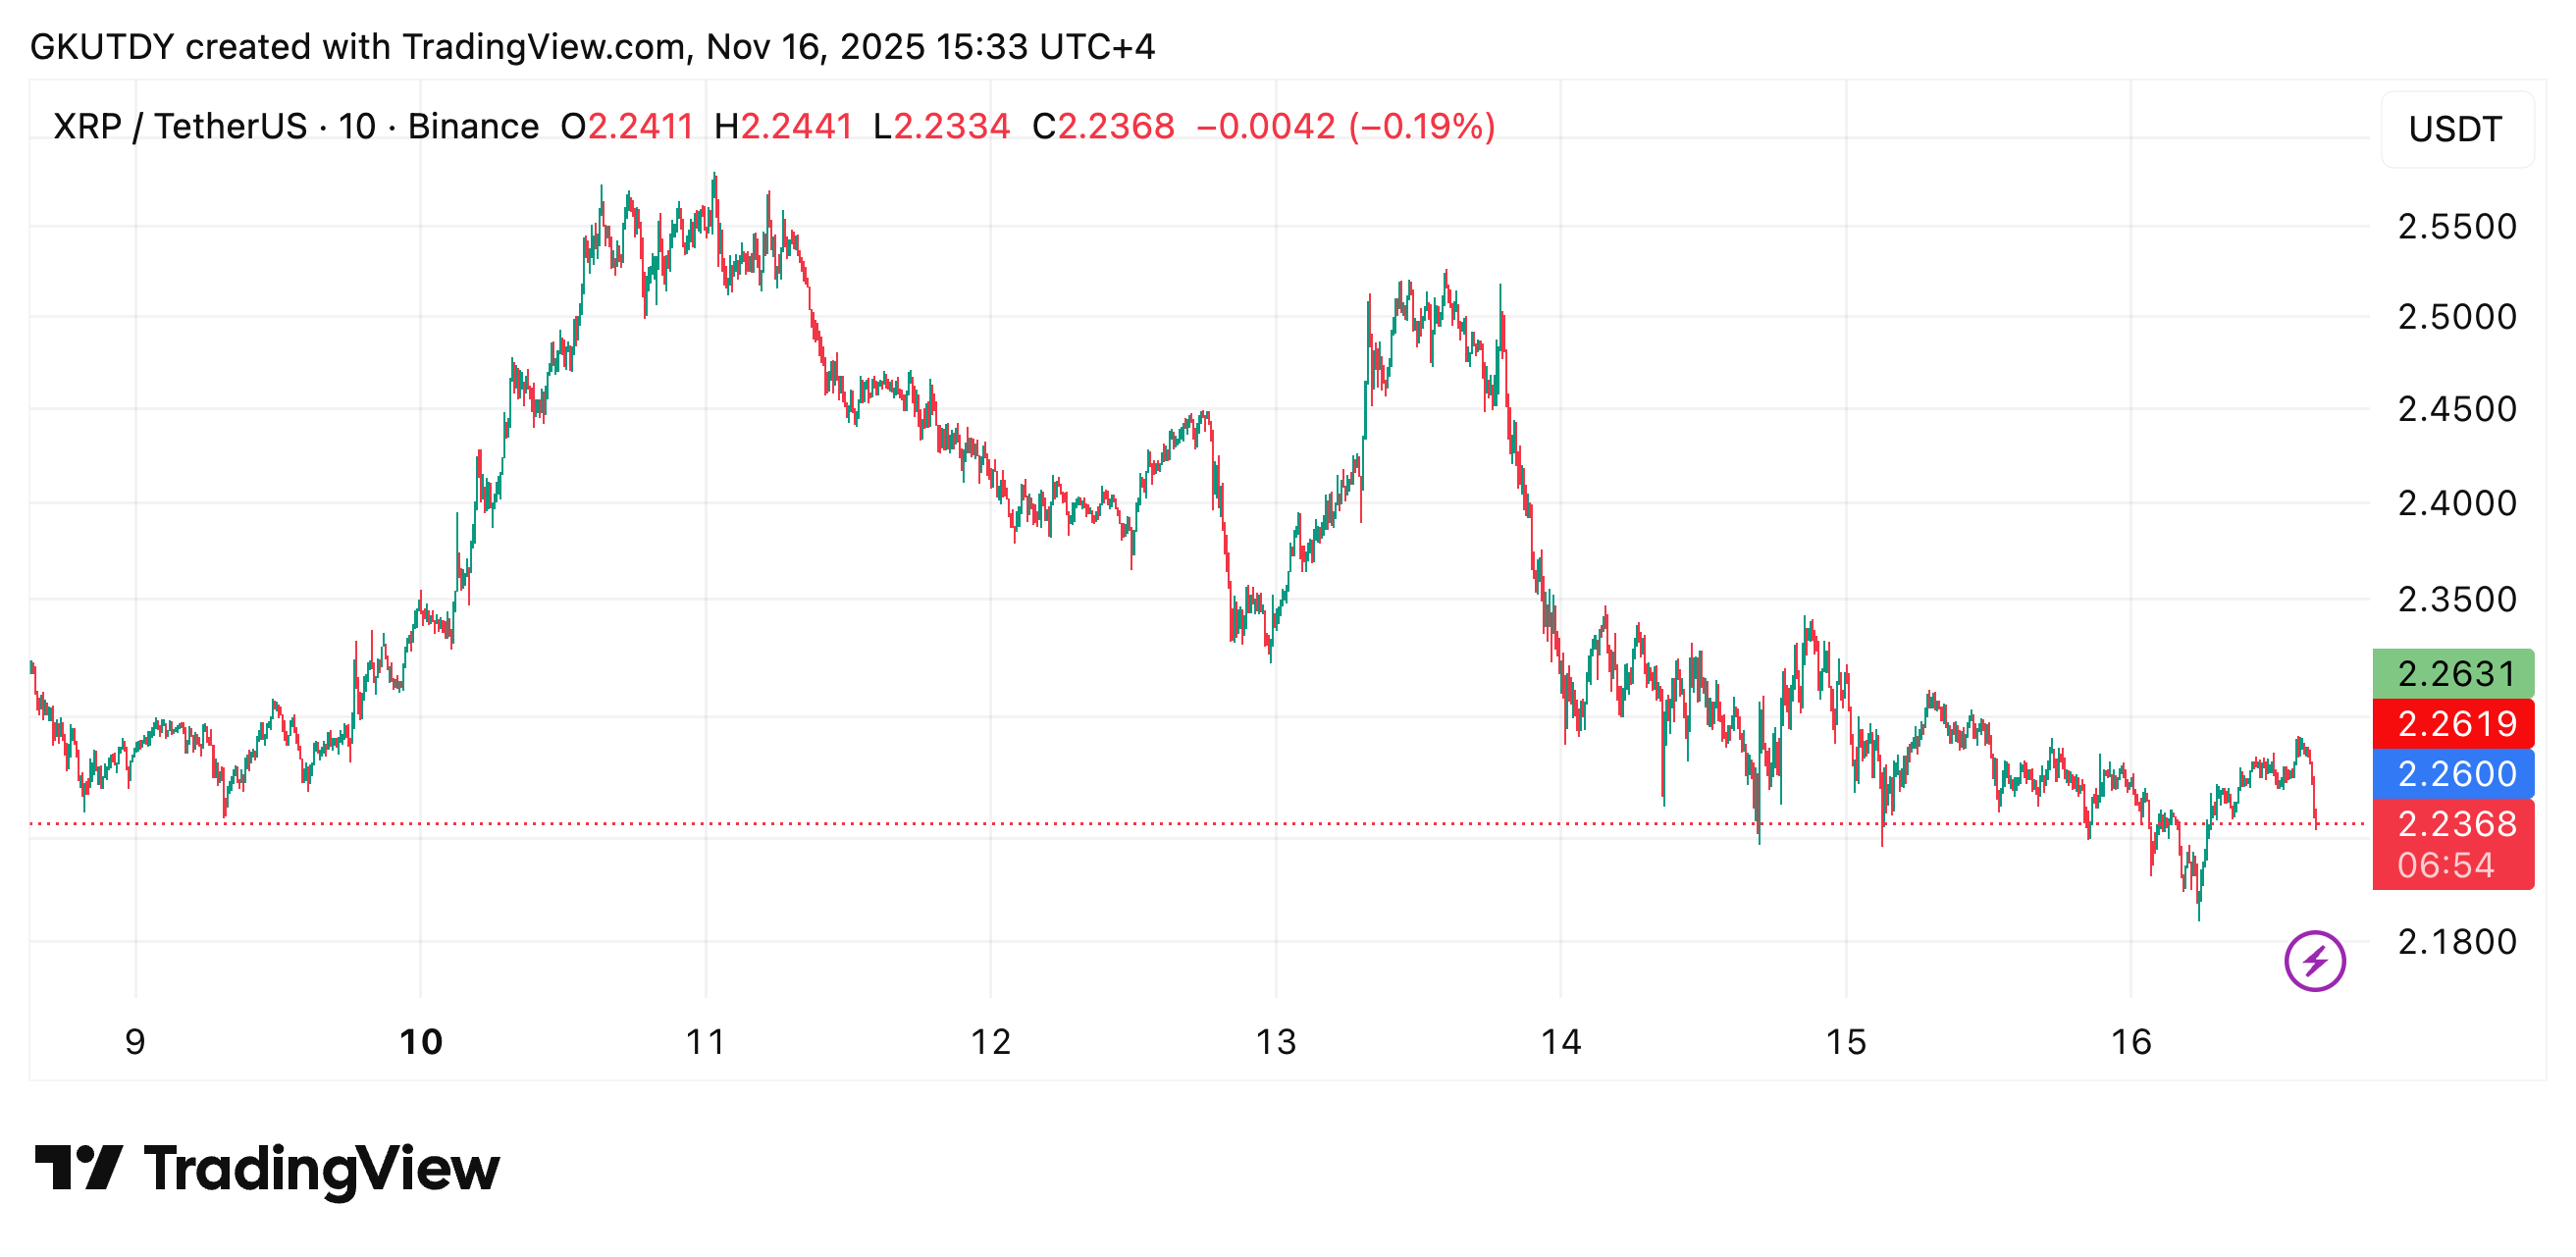
Meanwhile, XRP jumped a lot recently, hitting $2.34-$2.36, then dropping back down to $2.20-$2.22. There is no set pattern, so it’s not a place where you can just sit back and relax.
While clearances and oversized shorts dominate the headlines, XRP it features one of the few structured configurations in the entire market. The XRP/BTC pair is replicating the same 23-day and 50-day average interaction that defined the July rally, when the pair moved from 0.0000218 BTC to 0.00003073 BTC in a straight 12-day stretch, gaining 40.91% without any significant interruption.
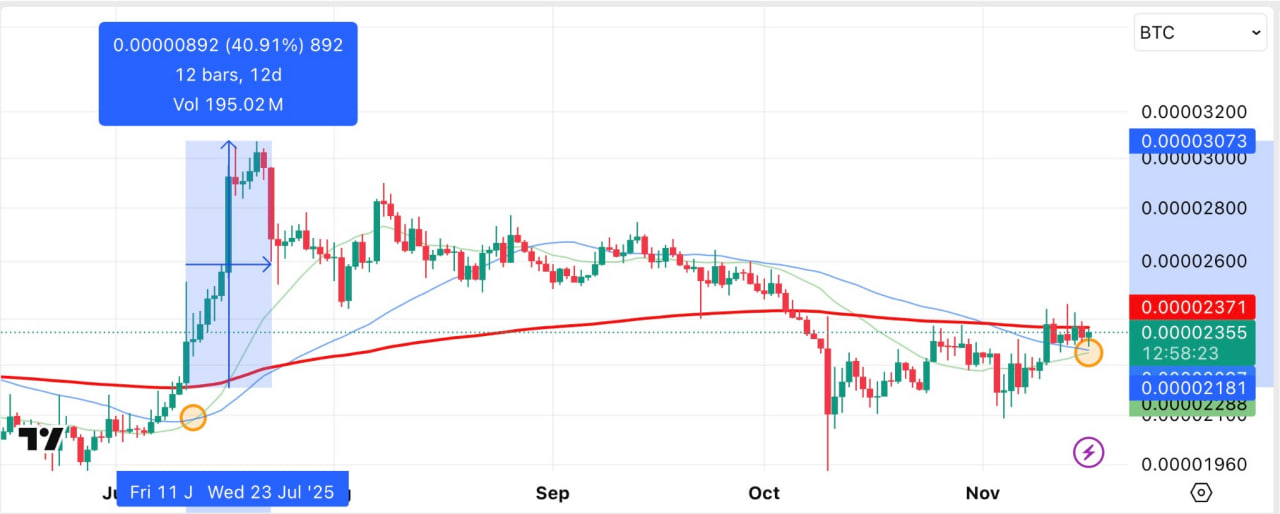
This time the alignment is almost identical: the moving averages compress, the slope corresponds to the profile of the summer, and the price is located directly on the starting zone. A complete replication of the July movement is not guaranteed, but even a partial repetition puts a 25-30% extension on the table, especially since BTC dominance continues to lose definition and can no longer suppress alt pairs by default.
The current Bitcoin price action around the $96,400 area further strengthens the setup. When Bitcoin fails to impose direction, relative strength assets like XRP/BTC gain the freedom to establish independent trends, and this particular configuration carries enough historical support to treat it as more than a coincidence.
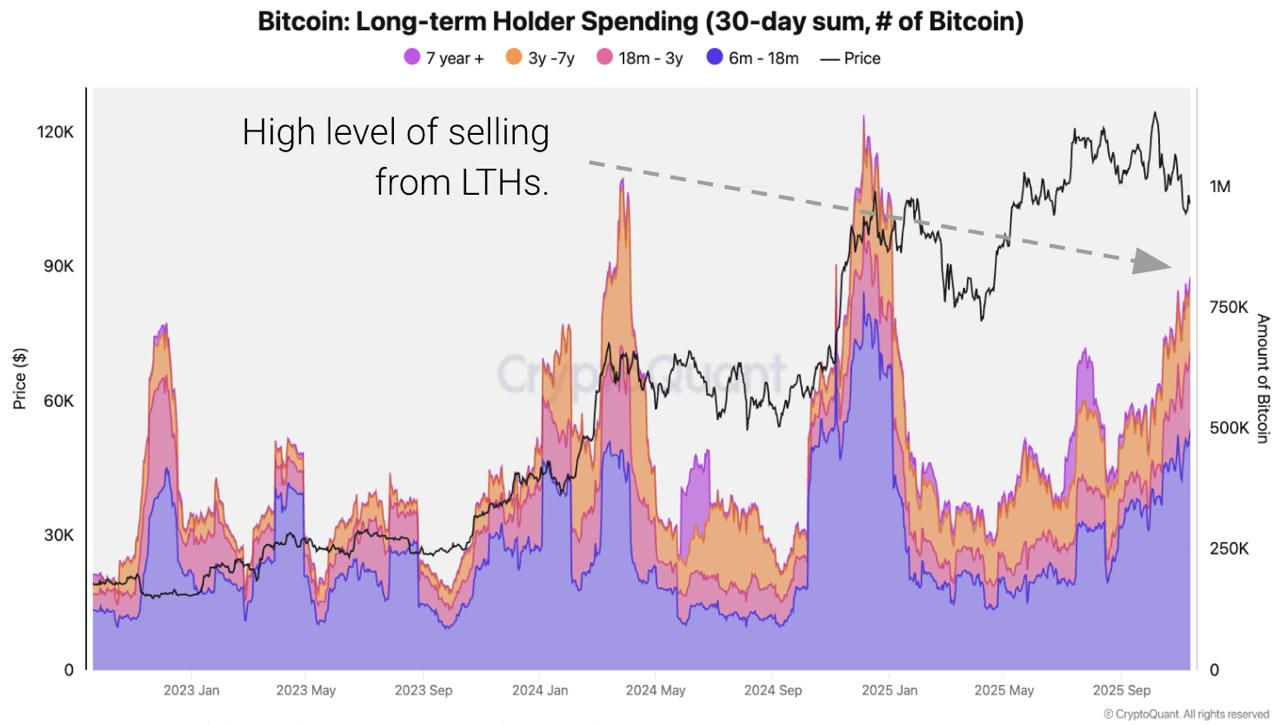
The macro picture becomes impossible to ignore once long-term holder behavior enters the picture. According to CryptoQuantlong-term holders sold 815,000 BTC in the past 30 days, marking the heaviest distribution wave since January 2024.
Historically, when long-term holders sell at this magnitude, the market does not collapse instantly. Instead, it enters a state of drift where technical signals lose reliability, rebounds fade quickly and dips fail to scale because every move is in competition with a stable supply injection.
This phase forces misreads: traders mistake pauses for reversals and spikes in volatility for trend changes, but the underlying mechanics is simply long-term supply absorption.
This wave of sales also aligns with a weak fourth season. CoinGlass data already puts Q4, 2025 in worse territory than Q4, 2022 and Q4, 2019, both remembered for prolonged downside phases that continued despite pockets of intraday strength. The combination of strong LTH flows and weak seasonal performance creates a deadlock where even logical rebound zones fail to create trend changes.
You may also like it

But there is a competing interpretation. The CEO of Bitwise, Hunter Horsley, argues that the market has already been in a bear phase for six months, it has not entered now, and that the structure is close to resolution as liquidity led by ETFs restructures the cycle. If correct, this 815,000 BTC wave represents the last stage of transition instead of its beginning.
The market enters the new week looking exactly like the type of landscape where nothing moves cleanly anymore: Bitcoin hovers around $96,000, alts are trying to build direction, and the whole market feels driven more by who is liquidated after than by any real narrative.